Sales Performance Analysis (2023 vs 2024)
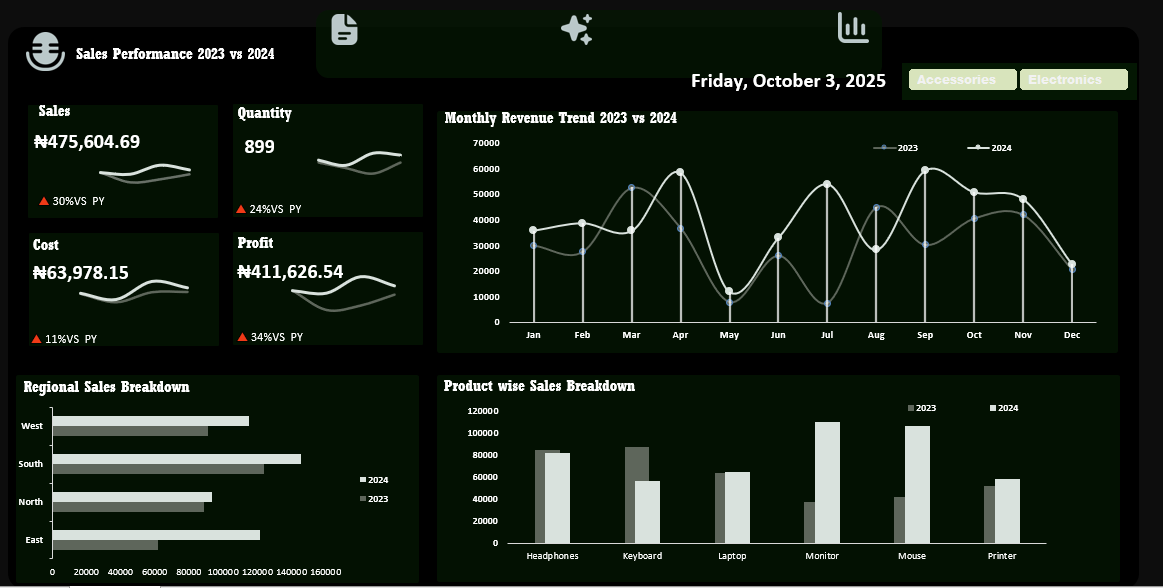
This project presents a comprehensive Sales Performance Analysis comparing business outcomes between 2023 and 2024. The analysis evaluates revenue growth, profitability, cost efficiency, regional performance, and product-level contributions using an interactive dashboard. The objective is to demonstrate how data-driven insights can support strategic decision-making, operational efficiency, and sustainable business growth..
94% Accuracy
30% YOY Growth
899 Units Sold